服务监控系统-Prometheus
 Prometheus 是一个开源的服务监控系统和时间序列数据库。采用Go语言开发并在Apache协议下授权。
Prometheus is an open-source systems monitoring and alerting toolkit originally built at SoundCloud. Since its inception in 2012, many companies and organizations have adopted Prometheus, and the project has a very active developer and user community. It is now a standalone open source project and maintained independently of any company. To emphasize this and clarify the project's governance structure, Prometheus joined the Cloud Native Computing Foundation in 2016 as the second hosted project after Kubernetes.
特性
具有由指标名称和键/值对标识的时间序列数据的多维数据模型
PromQL,一种灵活的查询语言
不依赖分布式存储(指的是普罗米修斯监控应用本身,不是说它不支持对分布式场景进行监控)
时间序列收集通过HTTP上的拉取模型(就是前面的 pull)进行
通过中间网关(就是前面的gateway)支持推送时间序列(就是前面的 push)
通过服务发现或静态配置发现目标
多种图形和仪表板支持模式
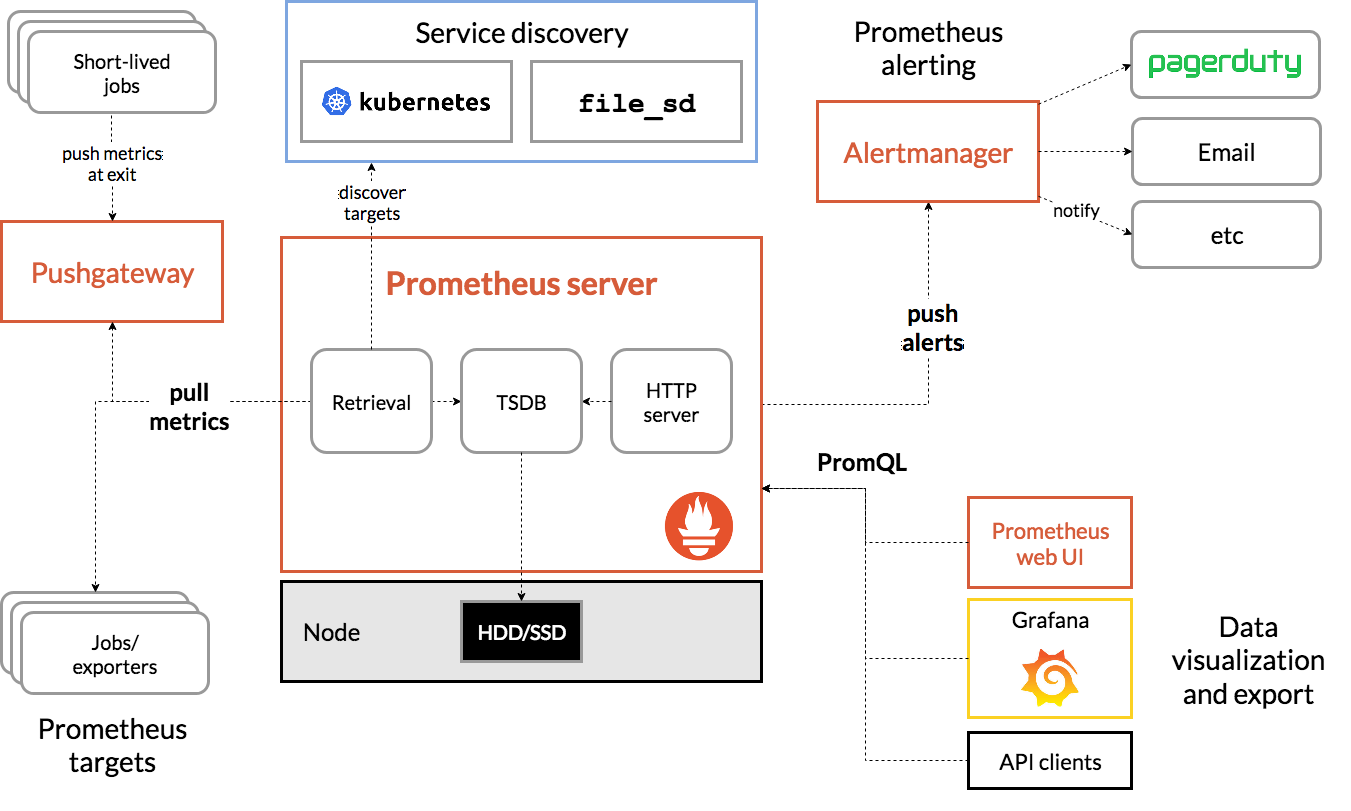
主要的组件的介绍:
用于采集和存取时间序列数据的 Prometheus server
用于监测应用的客户端库(client lib,在客户端这里,图中没有标出)
用于支持短期的作业(Short-lived jobs)的 push gateway
诸如 HAProxy,StatsD,Graphite 等服务的专用 exporter
用于处理告警的 alertmanager
PromQL是Prometheus内置了一个强大的数据查询语言
Grafana是可视化的工具
docker镜像是有Prometheus的,所以Prometheus能够在K8s上迅速的部署
Exporters/Jobs:Prometheus的数据采集组件,负责收集目标对象(host, container…)的性能数据,并通过HTTP接口提供给Prometheus Server。支持数据库、硬件、消息中间件、存储系统、http服务器、jmx等
Short-lived jobs:瞬时任务的场景,无法通过pull方式拉取,需要使用push方式,与PushGateway搭配使用
PushGateway:应对部分push场景的组件可选组件,这部分监控数据先推送到Push Gateway上,然后再由Prometheus Server端拉取 。用于存在时间较短,可能在Prometheus来拉取之前就消失了的 jobs
定义了开放指标数据标准:支持pull和push两种方式的数据采集,以基于HTTP的Pull方式采集时序数据,只有实现了prometheus监控数据格式才可以被prometheus采集;以Push方式向中间网关(Gateway)推送时序数据,能更灵活地应对各种监控场景
支持通过静态文件配置和动态发现机制发现监控对象,自动完成数据采集。prometheus目前已经支持Kubernetes、Consul等多种服务发现机制,可以减少运维人员的手动配置环节。
最新版本:1.0
官方主页:https://prometheus.io/