Linux中关于交换分区与虚拟内存和页的认识
 页:page
交换分区:swap
虚拟内存:virtual memory
以前的操作系统是实模式,例如dos,每个时候只有一个进程在跑,这个进程使用全部的物理内存。后来发展到保护模式,分时多进程,一个CPU上跑多个进程,但进程不知道到底有多少内存可以用,它能访问内存最大地址。例如16位系统就能访问2^16byte,32位就是2^32位。但是实际上没有那么多内存,该怎么办?保护模式就应运而生了。
为了提高磁盘存取效率,Linux做了一些精心的设计,除了对dentry进行缓存(用于VFS,加速文件路径名到inode的转换),还采取了两种主要Cache方式:Buffer Cache和Page Cache。前者针对磁盘块的读写,后者针对文件inode的读写,这些Cache有效缩短了I/O系统调用(比如read,write,getdents)的时间。
内存活动基本上可以用3个数字来量化:活动虚拟内存总量,交换(swapping)率和调页(paging)率。其中第一个数字表明内存的总需求量,后两个数字表示那些内存中有多少比例正处在使用之中。目标是减少内存活动或增加内存量,直到调页率保持在一个可以接受的水平上为止。
活动虚拟内存的总量(VM)=实际内存大小(size of real memory)(物理内存)+使用的交换空间大小(amount of swap space used)
当程序运行需要的内存大于物理内存时,linux系统采用了调页机制,即系统复制一些内存中的页面到磁盘上,腾出来空间供进程使用。大多数系统可以忍受偶尔的调页,但是频繁的调页会使系统性能急剧下降。
Linux系统通过2种方法进行内存管理:“调页算法”,“交换技术”。
调页算法是将内存中最近不常使用的页面换到磁盘上,把常使用的页面(活动页面)保留在内存中供进程使用。交换技术是系统将整个进程,而不是部分页面,全部换到磁盘上。正常情况下,系统会发生一些交换过程。当内存严重不足时,系统会频繁使用调页和交换,这增加了磁盘I/O的负载。进一步降低了系统对作业的执行速度,即系统I/O资源问题又会影响到内存资源的分配。
事实上,在每个进程创建加载时,内核只是为进程“创建”了虚拟内存的布局,具体就是初始化进程控制表中内存相关的链表,实际上并不立即就把虚拟内存对应位置的程序数据和代码(比如.text .data段)拷贝到物理内存中,只是建立好虚拟内存和磁盘文件之间的映射就好(叫做存储器映射),等到运行到对应的程序时,才会通过缺页异常,来拷贝数据。还有进程运行过程中,要动态分配内存,比如malloc时,也只是分配了虚拟内存,即为这块虚拟内存对应的页表项做相应设置,当进程真正访问到此数据时,才引发缺页异常。
可以认为虚拟空间都被映射到了磁盘空间中,(事实上也是按需要映射到磁盘空间上,通过mmap),并且由页表记录映射位置,当访问到某个地址的时候,通过页表中的有效位,可以得知此数据是否在内存中,如果不是,则通过缺页异常,将磁盘对应的数据拷贝到内存中,如果没有空闲内存,则选择牺牲页面,替换其他页面。
mmap是用来建立从虚拟空间到磁盘空间的映射的,可以将一个虚拟空间地址映射到一个磁盘文件上,当不设置这个地址时,则由系统自动设置,函数返回对应的内存地址(虚拟地址),当访问这个地址的时候,就需要把磁盘上的内容拷贝到内存了,然后就可以读或者写,最后通过manmap可以将内存上的数据换回到磁盘,也就是解除虚拟空间和内存空间的映射,这也是一种读写磁盘文件的方法,也是一种进程共享数据的方法:共享内存。
Linux的虚拟内存
这是一个十分复杂的子系统,它实现了进程间代码与数据共享机制的透明性,并能够分配比系统现有物理内存更多的内存,某些操作系统的虚存甚至能通过提供缓存功能影响到文件系统的性能,各种风格的linux的虚存的实现方式区别很大,但都离不开下面的4个概念。
1:实际内存,是指一个系统中实际存在的物理内存,称为RAM。实际内存是存储临时数据最快最有效的方式,因此必须尽可能地分配给应用程序,现在的RAM的形式有多种:SIMM、DIMM、Rambus、DDR等,很多RAM都可以使用纠错机制(ECC)。
2:交换空间,专门用于临时存储内存的一块磁盘空间,通常在页面调度和交换进程数据时使用,通常推荐交换空间的大小应该是物理内存的二到四倍。
3:页面调度,指从磁盘向内存传输数据,以及相反的过程,这个过程之所以被称为页面调度,是因为linux内存被平均划分成大小相等的页面;通常页面大小为 4KB和8KB。当可执行程序开始运行时,它的映象会一页一页地从磁盘中换入,与此类似,当某些内存在一段时间内空闲,就可以把它们换出到交换空间中,这样就可以把空闲的RAM交给其他需要它的程序使用。
4:交换,页面调度通常容易和交换的概念混淆,页面调度是指把一个进程所占内存的空闲部分传输到磁盘上,而交换是指当系统中实际的内存已不够满足新的分配需求时,把整个进程传输到磁盘上,交换活动通常意味着内存不足。
vmstat监视内存性能:该命令用来检查虚拟内存的统计信息,并可显示有关进程状态、空闲和交换空间、调页、磁盘空间、CPU负载和交换,cache刷新以及中断等方面的信息。
Buffer、Cache与Swap
1、buffer(缓冲)是为了提高内存和硬盘(或其他I/O设备)之间的数据交换的速度而设计的。buffer 的意思和 cache 相近,不过稍有区别。考虑内存写文件到硬盘的过程,因为硬盘太慢了,如果内存要等待数据写完之后才继续后面的操作,实在是效率很低的事情,也会影响程序的运行速度。所以就有了 buffer,写到硬盘的数据会放到 buffer 里面,内存很快把数据写到 buffer,可以继续其他的工作,而硬盘可以在后台慢慢读出 buffer 中的数据,保存起来。这样就提高了读写的效率!讲一个大家会经常遇到的情况,当我们把电脑里中的文件拷贝到 U 盘的时候,如果文件特别大,大家会遇到这种情况:明明看到文件已经拷贝完了,但系统还是会提示 U 盘正在使用中或硬盘指示灯一直亮着。这就是 buffer 的原因,拷贝程序把东西放到 buffer 之后,但是 U 盘还没有真正写完。同样的,可以手动来 flush buffer 的内容,命令是 sync。
2、cache(缓存)
a)从CPU角度考虑,是为了提高cpu和内存之间的数据交换速度而设计的,例如平常见到的一级缓存、二级缓存、三级缓存。 cpu在执行程序所用的指令和读数据都是针对内存的,也就是从内存中取得的。由于内存读写速度慢,为了提高cpu和内存之间数据交换的速度,在cpu和内存之间增加了cache,它的速度比内存快,但是造价高,又由于在cpu内不能集成太多集成电路,所以一般cache比较小,以后intel等公司为了进一步提高速度,又增加了二级cache,甚至三级cache,它是根据程序的局部性原理而设计的,就是cpu执行的指令和访问的数据往往在集中的某一块,所以把这块内容放入cache后,cpu就不用在访问内存了,这就提高了访问速度。当然若cache中没有cpu所需要的内容,还是要访问内存的。
b)从内存读取与磁盘读取角度考虑,cache可以理解为操作系统为了更高的读取效率,更多的使用内存来缓存可能被再次访问的数据。
缓冲(buffers)是根据磁盘的读写设计的,把分散的写操作集中进行,减少磁盘碎片和硬盘的反复寻道,从而提高系统性能。linux有一个守护进程定期清空缓冲内容(即写入磁盘),也可以通过sync命令手动清空缓冲。
简单来说,buffer是即将要被写入磁盘的,而cache是被从磁盘中读出来的。buffer是由各种进程分配的,被用在如输入队列等方面。一个简单的例子如某个进程要求有多个字段读入,在所有字段被读入完整之前,进程把先前读入的字段放在buffer中保存。cache经常被用在磁盘的I/O请求上,如果有多个进程都要访问某个文件,于是该文件便被做成cache以方便下次被访问,这样可提高系统性能。当系统读文件的时候,都是把数据从硬盘读到内存里,因为硬盘比内存慢很多,所以这个过程会很耗时。为了提高效率,linux 会把读进来的文件在内存中缓存下来(因为读取相近部分的内容是程序很常见的情况),即使程序结束,cache 也不会被自动释放。如果有程序进行大量的读文件操作,你会发现内存使用率就上去了。
不过也不用担心,如果其他程序使用要使用内存的时候,linux 也会把这些没人使用的 cache 释放掉以让给其它运行的程序使用。当然也可以手动去释放掉这部分内存。
在Linux的内存管理中,buffer指linux内存的:Buffer cache,cache指linux内存中的:Page cache,翻译成中文可以叫做缓冲区缓存和页面缓存。在历史上,它们一个(buffer)被用来当成对io设备写的缓存,而另一个(cache)被用来当作对io设备的读缓存,这里的io设备,主要指的是块设备文件和文件系统上的普通文件。但是现在它们的意义已经不一样了。在当前的内核中,page cache顾名思义就是针对内存页的缓存,如果有内存是以page进行分配管理的,都可以使用page cache作为其缓存来管理使用。当然不是所有的内存都是以页(page)进行管理的,也有很多是针对块(block)进行管理的,这部分内存使用如果要用到cache功能,则都集中到buffer cache中来使用。(buffer cache改名叫做block cache岂不更好?)然而也不是所有块(block)都有固定长度,系统上块的长度主要是根据所使用的块设备决定的,而页长度在x86体系上无论是32位还是64位都是4k。
Page Cache
Page cache主要用来作为文件系统上的文件数据的缓存来用,尤其是针对当进程对文件有read/write操作的时候。作为可以映射文件到内存的系统调用:mmap是不是很自然的也应该用到page cache?在当前的系统实现里,page cache也被作为其它文件类型的缓存设备来用,所以事实上page cache也负责了大部分的块设备文件的缓存工作。
Buffer Cache
Buffer cache则主要是设计用来在系统对块设备进行读写的时候,对块进行数据缓存的系统来使用。这意味着某些对块的操作会使用buffer cache进行缓存,比如我们在格式化文件系统的时候。一般情况下两个缓存系统是一起配合使用的,比如当我们对一个文件进行写操作的时候,page cache的内容会被改变,而buffer cache则可以用来将page标记为不同的缓冲区,并记录是哪一个缓冲区被修改了。这样内核在后续执行脏数据的回写(writeback)时,就不用将整个page写回,而只需要写回修改的部分即可。
回收cache
Linux内核会在内存将要耗尽的时候,触发内存回收的工作,以便释放出内存给急需内存的进程使用。一般情况下,这个操作中主要的内存释放都来自于对buffer/cache的释放,尤其是被使用更多的cache空间。既然它主要用来做缓存,只是在内存够用的时候加快进程对文件的读写速度,那么在内存压力较大的情况下,当然有必要清空释放cache,作为free空间分给相关进程使用。所以一般情况下,我们认为buffer/cache空间可以被释放,这个理解是正确的。
但是这种清缓存的工作也并不是没有成本。理解cache是干什么的就可以明白清缓存必须保证cache中的数据跟对应文件中的数据一致,才能对cache进行释放。所以伴随着cache清除的行为的,一般都是系统IO的升高。因为内核要对比cache中的数据和对应硬盘文件上的数据是否一致,如果不一致需要写回,之后才能回收和释放。
那buffers和cached都是缓存,两者有什么区别呢?
为了提高磁盘存取效率,Linux做了一些精心的设计,除了对dentry进行缓存(用于VFS,加速文件路径名到inode的转换),还采取了两种主要Cache方式:Buffer Cache和Page Cache。前者针对磁盘块的读写,后者针对文件inode的读写,这些Cache有效缩短了 I/O系统调用(比如read,write,getdents)的时间。磁盘的操作有逻辑级(文件系统)和物理级(磁盘块),这两种Cache就是分别缓存逻辑和物理级数据的。
Page cache实际上是针对文件系统的,是文件的缓存,在文件层面上的数据会缓存到page cache。文件的逻辑层需要映射到实际的物理磁盘,这种映射关系由文件系统来完成。当page cache的数据需要刷新时,page cache中的数据交给buffer cache,因为Buffer Cache就是缓存磁盘块的。但是这种处理在2.6版本的内核之后就变的很简单了,没有真正意义上的cache操作。
Buffer cache是针对磁盘块的缓存,也就是在没有文件系统的情况下,直接对磁盘进行操作的数据会缓存到buffer cache中,例如,文件系统的元数据都会缓存到buffer cache中。
简单说来,page cache用来缓存文件数据,buffer cache用来缓存磁盘数据。在有文件系统的情况下,对文件操作,那么数据会缓存到page cache,如果直接采用dd等工具对磁盘进行读写,那么数据会缓存到buffer cache。所以看linux内存是否不足,只要不用swap的交换空间就不用担心内存太少;如果常常swap用很多,可能就要考虑加物理内存了。这也是linux看内存是否够用的标准,如果是应用服务器的话,一般只看第二行,'buffers/cache':即对应用程序来说free的内存太少了,也是该考虑优化程序或加内存了。
以总和的形式显示内存的使用信息
命令:free -t
以友好可读的形式显示内存的使用信息
命令:free -h|-g
说明:将会换算为友好的单位
期性的查询内存使用信息
命令:free -s 9
说明:每9s 执行一次命令
在系统中除了内存将被耗尽的时候可以清缓存以外,我们还可以使用下面这个操作来人为地触发缓存清除的操作:
# cat /proc/sys/vm/drop_caches
0
方法是:
sync; echo 1 > /proc/sys/vm/drop_caches
当然这个文件可以设置的值分别为1、2、3,它们所表示的含义如下:
1表示清除pagecache(Clear PageCache only)。
sync; echo 1 > /proc/sys/vm/drop_caches
2表示清除回收slab分配器中的对象(包括目录项缓存和inode缓存)。slab分配器是内核中管理内存的一种机制,其中很多缓存数据实现都是用的pagecache(Clear dentries and inodes)。
sync; echo 2 > /proc/sys/vm/drop_caches
3表示清除pagecache和slab分配器中的缓存对象(Clear PageCache, dentries and inodes)。
sync; echo 3 > /proc/sys/vm/drop_caches
查看buffers与cache中都是存储着什么
linux-ftools这个工具集中有一个fincore的指令可以查看buffers 和 cache中的的文件对象。
fincore [options] files...
--pages=false Do not print pages
--summarize When comparing multiple files, print a summary report
--only-cached Only print stats for files that are actually in cache.
# fincore --pages=false --summarize --only-cached *
stats for CLUSTER_LOG_2010_05_21.MYI: file size=93840384 , total pages=22910 , cached pages=1 , cached size=4096, cached perc=0.004365
stats for CLUSTER_LOG_2010_05_22.MYI: file size=417792 , total pages=102 , cached pages=1 , cached size=4096, cached perc=0.980392
stats for CLUSTER_LOG_2010_05_23.MYI: file size=826368 , total pages=201 , cached pages=1 , cached size=4096, cached perc=0.497512
stats for CLUSTER_LOG_2010_05_24.MYI: file size=192512 , total pages=47 , cached pages=1 , cached size=4096, cached perc=2.127660
stats for CLUSTER_LOG_2010_06_03.MYI: file size=345088 , total pages=84 , cached pages=43 , cached size=176128, cached perc=51.190476
---
total cached size: 32847278080
通过上面的输出,可以看到 *.MYD, *.MYI, and *.frm 这些类型的文件当前被缓存着。
3、swap
swap 是实现虚拟内存的重要概念。如果系统的负载太大,内存被用完,可能会出现严重的问题。swap 就是把硬盘上一部分空间当做内存使用,正在运行程序会使用物理内存,把没有正在使用的内存放到硬盘,这叫做 swap out;而把硬盘 swap 部分的内存重新放到物理内存中,叫做 swap in。
swap 可以再逻辑上扩大内存空间,但是会造成系统变慢,因为硬盘读写速度很慢。linux 系统会把那些不怎么频繁使用的内存放到 swap中。附带地介绍一下如何清空swap分区的内容:
swapoff -a && swapon -a
下面的指令将会把系统中所有带缓存的地方全部清理一次:
# echo 3 > /proc/sys/vm/drop_caches && swapoff -a && swapon -a && printf '\n%s\n' 'Ram-cache and Swap Cleared'
清理磁盘缓存
# blockdev --flushbufs /dev/sda
# hdparm -F /dev/sda
swappiness参数
它用于内存与交换分区之间优化作用,swappiness的值的大小对如何使用swap分区是有着很大的联系的。swappiness=0的时候表示最大限度使用物理内存,然后才是 swap空间,swappiness=100的时候表示积极的使用swap分区,并且把内存上的数据及时的搬运到swap空间里面。Linux的基本默认设置为60,值越大表示越倾向于使用swap。可以设为0,这样做并不会禁止对swap的使用,只是最大限度地降低了使用swap的可能性。
查看该值
cat /proc/sys/vm/swappiness
60
也就是说,你的内存在使用到100-60=40%的时候,就开始出现有交换分区的使用。内存的速度比磁盘快很多,这样会加大系统io调用,同时造的成大量页的换进换出,严重影响系统的性能,所以我们在操作系统层面,要尽可能使用内存,对该参数进行调整。
临时调整的方法如下,调成10:
# sysctl vm.swappiness=10
vm.swappiness = 10
这只是临时调整的方法,重启后会回到默认设置的,要想永久调整的话,可在/etc/sysctl.conf修改,加上:
vm.swappiness=10
激活设置
# sysctl -p
在linux中,可以通过修改swappiness内核参数,降低系统对swap的使用,从而提高系统的性能。
在现实中有许多空闲内存时确使用了swap是什么原因?
在某一个很短的时间内对内存的使用的相当高,后随着程序的完成退出并释放掉了相应的内存。虽然这个临时内存使用没有到达服务器的物理内存,但确发现内存使用达到一定占比后时系统开始使用swap。在swap的过程中系统性能会有所下降。对这种情况,可以通过调节swappiness内核参数降低系统对swap的使用,从而避免不必要的swap对性能造成的冲击。
通过sysctl -q vm.swappiness可以查看系统级参数的当前设置。
修改该参数的方法是编辑/etc/sysctl.conf文件,加入vm.swappiness=nn,并重起系统。这个操作相当于是修改虚拟系统中的/proc/sys/vm/swappiness文件,将值改为nn数值。
如果不想重起,可以通过sysctl -p动态加载/etc/sysctl.conf文件,但建议这样做之前先清空swap。
Linux一个进程使用的内存分为2种:
file-backed pages(有文件背景的页面,比如代码段、比如read/write方法读写的文件、比如mmap读写的文件;他们有对应的硬盘文件,因此如果要交换,可以直接和硬盘对应的文件进行交换),此部分页面进page cache
anonymous pages(匿名页,如stack,heap,CoW后的数据段等;他们没有对应的硬盘文件,因此如果要交换,只能交换到虚拟内存-swapfile或者Linux的swap硬盘分区),此部分页面,如果系统内存不充分,可以被swap到swapfile或者硬盘的swap分区
因此,Linux在进行内存回收(memory reclaim)的时候,实际上可以从1类和2类这两种页面里面进行回收,而swappiness就决定了回收这2类页面的优先级。swappiness越大,越倾向于回收匿名页;swappiness越小,越倾向于回收file-backed的页面。当然,它们的回收方法都是一样的LRU算法。
free指令
free命令是监控linux内存使用最常用的命令
参数说明:
-m:以M为单位查看内存使用情况(默认为kb)
-b:以字节为单位查看内存使用情况
-s:可以在指定时间段内不简单监控内存的使用情况
[root@freeoa ~]# free -m
total used free shared buffers cached
Mem: 32059 31847 212 0 180 18948
-/+ buffers/cache: 12718 19341
Swap: 16383 268 16115
Mem:表示物理内存统计
-/+ buffers/cached:表示物理内存的缓存统计
Swap:表示硬盘上交换分区的使用情况,
第1行 Mem:
total:表示物理内存总量。
used:表示总计分配给缓存(包含buffers与cache)使用的数量,但其中可能部分缓存并未实际使用。
free:未被分配的内存。
shared:共享内存,一般系统不会用到。
buffers:系统分配但未被使用的buffers数量。
cached:系统分配但未被使用的cache数量。
total = used + free
第2行 -/+ buffers/cached:
used:也就是第一行中的used - buffers-cached 也是实际使用的内存总量。
free:未被使用的buffers 与cached 和未被分配的内存之和,这就是系统当前实际可用内存=free+buffers+cached。
因为buffers和cached是系统为了提高性能申请的内存数,实际上当应用程序需要此功能时,是可以使用这些内存的,所以对应用程序来说,这些内存也是可以使用的。
free命令可以显示Linux系统中空闲的、已用的物理内存及swap内存、以及被内核使用的buffer。在Linux系统监控的工具中,free命令是最经常使用的命令之一,下面将详述其用法。
1.命令格式:
free [参数]
2.命令功能:
free 命令显示系统使用和空闲的内存情况,包括物理内存、交互区内存(swap)和内核缓冲区内存。共享内存将被忽略
3.命令参数:
-b:以Byte为单位显示内存使用情况。
-k:以KB为单位显示内存使用情况。
-m:以MB为单位显示内存使用情况。
-g:以GB为单位显示内存使用情况。
-o:不显示缓冲区调节列。
-s<间隔秒数>:持续观察内存使用状况。
-t:显示内存总和列。
-V:显示版本信息。
4.使用实例:
实例1:显示内存使用情况
命令:
free
free -g
free -m
free -h
$ free -m
total used free shared buff/cache available
Mem: 4098 712 3050 13 335 3041
Swap: 494 0 494
说明:下面是对这些数值的解释:
total:物理内存大小,就是机器实际的内存
used:已使用的内存大小,这个值包括了 cached 和 应用程序实际使用的内存
free:未被使用的内存大小
shared:共享内存大小,是进程间通信的一种方式
buff:被磁盘缓冲区占用的内存大小
cache:被磁盘缓存占用的内存大小
available 可用内存
其中有
total = used + free
下面一行,代表应用程序实际使用的内存:
前一个值表示 - buff/cache,即 used - buff/cache,表示应用程序实际使用的内存
后一个值表示 + buff/cache,即 free + buff/cache,表示理论上都可以被使用的内存
total = used + free + buff/cache
buff/cache = buffers + cache
available = free + buff/cache - 不可释放部分
第三行(-/+ buff/cache):
used:已使用多大。
free:可用有多少。
第四行是交换分区Swap的,也就是我们通常所说的虚拟内存。
区别:第二行(mem)的used/free与第三行(-/+ buff/cache) used/free的区别。这两个的区别在于使用的角度来看,第一行是从OS的角度来看,因为对于OS,buff/cache 都是属于被使用,所以已用内存包括,内核(OS)使用+Application(X, oracle,etc)使用的+buffers+cached。
第三行所指的是从应用程序角度来看,对于应用程序来说,buff/cache是等于可用的,因为buffer/cached是为了提高文件读取的性能,当应用程序需在用到内存的时候,buffer/cached会很快地被回收。
所以从应用程序的角度来说,可用内存=系统free memory+buff+cache。
对Linux free 命令中的'share'列的理解
"Shared" in free and "Shmem" in /proc/meminfo count all the memory used by the tmpfs file system (a file system in the memory) and also the shared memory (allocated by shmget(2)). This is documented at here.
共享内存就是进程之间可以共享的一段内存,通过一个唯一的Key值绑定
shmget()创建或获取
shmat()连接
shmdt()断连
共享内存的访问涉及同步措施,通常与信号灯一起使用,用ipcs -m命令可以查看系统中已有的共享内存段。在虚拟目录'/proc/sys/kernel/'下以'shm'开头的几个文件是共享内存的参数。
ipcs -m:查看Shared Memory 共享内存
ipcs -q:查看Message Queues 消息队列
ipcs -s:查看Semaphore Arrays 信号量
使用命令'ipcs -al'可列出相关的限制设定
------ Shared Memory Limits --------
max number of segments = 4096
max seg size (kbytes) = 4091826
max total shared memory (pages) = 2097152
min seg size (bytes) = 1
接下来解释什么时候内存会被交换、以什么方交换。 当可用内存少于额定值的时候,就会开会进行交换,通过下面的指令查看:cat /proc/meminfo
交换将通过三个途径来减少系统中使用的物理页面的个数:
1.减少缓冲与页面cache的大小,
2.将系统V类型的内存页面交换出去,
3.换出或者丢弃页面(Application 占用的内存页,也就是物理内存不足)。
事实上少量地使用swap是不是影响到系统性能的。
内核态与用户态
用户态:Ring3运行于用户态的代码则要受到处理器的诸多检查,它们只能访问映射其地址空间的页表项中规定的在用户态下可访问页面的虚拟地址,且只能对任务状态段(TSS)中I/O许可位图(I/O Permission Bitmap)中规定的可访问端口进行直接访问。
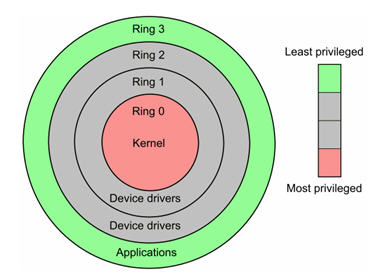
内核态:Ring0在处理器的存储保护中,核心态,或者特权态(与之相对应的是用户态),是操作系统内核所运行的模式。运行在该模式的代码,可以无限制地对系统存储、外部设备进行访问。
一、用户态和内核态
现在我们从特权级的调度来理解用户态和内核态就比较好理解了,当程序运行在3级特权级上时,就可以称之为运行在用户态,因为这是最低特权级,是普通的用户进程运行的特权级,大部分用户直接面对的程序都是运行在用户态;反之,当程序运行在级特权级上时,就可以称之为运行在内核态。虽然用户态下和内核态下工作的程序有很多差别,但最重要的差别就在于特权级的不同,即权力的不同。运行在用户态下的程序不能直接访问操作系统内核数据结构和程序。当我们在系统中执行一个程序时,大部分时间是运行在用户态下的,在其需要操作系统帮助完成某些它没有权力和能力完成的工作时就会切换到内核态。
二、用户态切换到内核态的3种方式
1)系统调用:这是用户态进程主动要求切换到内核态的一种方式,用户态进程通过系统调用申请使用操作系统提供的服务程序完成工作。而系统调用的机制其核心还是使用了操作系统为用户特别开放的一个中断来实现,例如Linux的int 80h中断。
2)异常:当CPU在执行运行在用户态下的程序时,发生了某些事先不可知的异常,这时会触发由当前运行进程切换到处理此异常的内核相关程序中,也就转到了内核态,比如缺页异常。
3)外围设备的中断:当外围设备完成用户请求的操作后,会向CPU发出相应的中断信号,这时CPU会暂停执行下一条即将要执行的指令转而去执行与中断信号对应的处理程序,如果先前执行的指令是用户态下的程序,那么这个转换的过程自然也就发生了由用户态到内核态的切换。比如硬盘读写操作完成,系统会切换到硬盘读写的中断处理程序中执行后续操作等。
此3种方式是系统在运行时由用户态转到内核态的最主要方式,其中系统调用可以认为是用户进程主动发起的,异常和外围设备中断则是被动的。
三、具体的切换步骤
从触发方式上看,可以认为存在前述3种不同的类型,但是从最终实际完成由用户态到内核态的切换操作上来说,涉及的关键步骤是完全一致的,没有任何区别,都相当于执行了一个中断响应的过程,因为系统调用实际上最终是中断机制实现的,而异常和中断的处理机制基本上也是一致的,关于它们的具体区别这里不再赘述。关于中断处理机制的细节和步骤这里也不做过多分析,涉及到由用户态切换到内核态的步骤主要包括:
从当前进程的描述符中提取其内核栈的ss0及esp0信息。
使用ss0和esp0指向的内核栈将当前进程的cs,eip,eflags,ss,esp信息保存起来,这个过程也完成了由用户栈到内核栈的切换过程,同时保存了被暂停执行的程序的下一条指令。将先前由中断向量检索得到的中断处理程序的cs,eip信息装入相应的寄存器,开始执行中断处理程序,这时就转到了内核态的程序执行了。
从用户态切换到核心态,要耗掉>100 cycle的CPU时钟。
Linux下内存使用率的计算
How to Measure Memory Usage in Linux
Linux provides a handful tools for measuring and checking memory usage. In this tutorial, we are going to learn a quite a number of these tools so that we can be able to troubleshoot any memory related issues.
free
free command is one of the most popular commands for checking free and used physical memory as well as swap space on Linux system. It also shows the buffers and caches used by the kernel. Below are basic examples of the free command.
# free -h
total used free shared buff/cache available
Mem: 15G 6.1G 3.3G 574M 6.1G 8.5G
Swap: 7.9G 0B 7.9G
The -h option shows the output fields automatically scaled to shortest three digit unit and display the units of print out. You may also use -b, -k, -m, -g to display the output in bytes, kilobytes, megabytes, gigabytes respectively.
The displayed columns are:
total – shows the total installed memory (MemTotal and SwapTotal in /proc/meminfo)
used – Used memory (calculated as total – free – buffers – cache)
free – Unused memory (MemFree and SwapFree in /proc/meminfo)
shared – Memory used (mostly) by tmpfs (Shmem in /proc/meminfo)
buffers – Memory used by kernel buffers (Buffers in /proc/meminfo)
cache – Memory used by the page cache and slabs (Cached and Slab in /proc/meminfo)
buff/cache – Sum of buffers and cache
available – Estimation of how much memory is available for starting new applications, without swapping.
/proc/meminfo
/proc/meminfo reports a large amount of valuable information about the system's RAM usage. To read this file, you can use cat command of paging commands like less.Much of the information in /proc/meminfo is used by the free, top, and ps commands. The output of the free command is similar in appearance to the contents and structure of /proc/meminfo.
You may be interested in the output of the /proc/meminfo include:
MemTotal: Total amount of usable RAM.
MemFree: The amount of physical RAM left unused by the system.
MemAvailable: An estimate of how much memory is available for starting new applications, without swapping.
Buffers: The amount of temporary storage for raw disk blocks.
Cached: The amount of physical RAM used as cache memory.
SwapCached: The amount of memory that has once been moved into swap, then back into the main memory.
SwapTotal: The total amount of swap available.
SwapFree: The total amount of swap free.
Note the the units of the /proc/meminfo is in kibibytes (KiB; 1 KiB equals 1024 B).
top
The top program provides a dynamic real-time view of a running system. This also enables you to check per process memory usage. To use top command to check per process memory, just run the command and press Shift+m to sort processes by memory usage in descending order.
You can also override the top command sort field by passing -o fieldname option. You can prepend a '+' or '-' to the field name to also override the sort direction. A leading '+' will force sorting high to low, whereas a '-' will ensure a low to high ordering. See example below
top -o +%MEM
htop
Just like top command, htop is an interactive process viewer. It shows per process memory usage along with various other details. To sort the htop out put with memory usage field, run the command below:
htop -s PERCENT_MEM
vmstat
when vmstat command is run with -s or –stats option displays a table of various event counters and memory statistics. You can display the units in megabytes by passing the -S M option:
vmstat -sS M
Well, so far so good, we have described and learnt a few simple commands that can enable us to track memory usage on a Linux machine. I am sure this article has been of help. Thank you for reading.
重点讲一下/proc/meminfo
Fields of /proc/meminfo
The information comes in the form of both high and low statistics. At the top you see a summary of the most common values people would like to look at. Below you find the individual values we will discuss. We will first discuss the high-statistics.
High level statistics
MemTotal: Total usable ram (i.e. physical ram minus a few reserved bits and the kernel binary code)
MemFree: Is sum of LowFree+HighFree (overall stat)
MemShared: 0; is here for compat reasons but always zero.
Buffers: Memory in buffer cache. mostly useless as metric nowadays Relatively temporary storage for raw disk blocks shouldn't get tremendously large (20MB or so)
Cached: Memory in the pagecache (diskcache) minus SwapCache, Doesn't include SwapCached
SwapCache: Memory that once was swapped out, is swapped back in but still also is in the swapfile (if memory is needed it doesn't need to be swapped out AGAIN because it is already in the swapfile. This saves I/O)
Detailed statistics
1. VM Statistics
VM splits the cache pages into "active" and "inactive" memory. The idea is that if you need memory and some cache needs to be sacrificed for that, you take it from inactive since that's expected to be not used. The vm checks what is used on a regular basis and moves stuff around.
The statistics are:
Active: Memory that has been used more recently and usually not reclaimed unless absolute necessary.
Inact_dirty: Dirty means "might need writing to disk or swap." Takes more work to free. Example might be files that have not been written to yet. They aren't written to memory too soon in order to keep the I/O down. For instance, if you're writing logs, it might be better to wait until you have a complete log ready before sending it to disk.
Inact_clean: Assumed to be easily free-able. The kernel will try to keep some clean stuff around always to have a bit of breathing room.
Inact_target: Just a goal metric the kernel uses for making sure there are enough inactive pages around. When exceeded, the kernel will not do work to move pages from active to inactive. A page can also get inactive in a few other ways, e.g. if you do a long sequential I/O, the kernel assumes you're not going to use that memory and makes it inactive preventively. So you can get more inactive pages than the target because the kernel marks some cache as "more likely to be never used" and lets it cheat in the "last used" order.
2. Memory Statistics
HighTotal: is the total amount of memory in the high region. Highmem is all memory above (approx) 860MB of physical RAM. Kernel uses indirect tricks to access the high memory region. Data cache can go in this memory region.
LowTotal: The total amount of non-highmem memory.
LowFree: The amount of free memory of the low memory region. This is the memory the kernel can address directly. All kernel data structures need to go into low memory.
SwapTotal: Total amount of physical swap memory.
SwapFree: Total amount of swap memory free. Memory which has been evicted from RAM, and is temporarily on the disk
Dirty: Memory which is waiting to get written back to the disk
Writeback: Memory which is actively being written back to the disk
Mapped: files which have been mapped, such as libraries
Slab: in-kernel data structures cache
Committed_AS: An estimate of how much RAM you would need to make a 99.99% guarantee that there never is OOM (out of memory) for this workload. Normally the kernel will overcommit memory. That means, say you do a 1GB malloc, nothing happens,really. Only when you start USING that malloc memory you will get real memory on demand, and just as much as you use. So you sort of take a mortgage and hope the bank doesn't go bust. Other cases might include when you mmap a file that's shared only when you write to it and you get a private copy of that data. While it normally is shared between processes. The Committed_AS is a guesstimate of how much RAM/swap you would need worst-case.
PageTables: amount of memory dedicated to the lowest level of page tables.
ReverseMaps: number of reverse mappings performed
VmallocTotal: total size of vmalloc memory area
VmallocUsed: amount of vmalloc area which is used
VmallocChunk: largest contigious block of vmalloc area which is free
The following table shows how to get the free output matched to the /proc/meminfo fields in Red Hat Enterprise Linux 5, 6 and 7.free cmd output coresponding /proc/meminfo fields
Mem: total MemTotal
Mem: used MemTotal - MemFree
Mem: free MemFree
Mem: shared (can be ignored nowadays. It has no meaning.) N/A
Mem: buffers Buffers
Mem: cached Cached
-/+ buffers/cache: used MemTotal - (MemFree + Buffers + Cached)
-/+ buffers/cache: free MemFree + Buffers + Cached
Swap: total SwapTotal
Swap: used SwapTotal - SwapFree
Swap: free SwapFree
The following table shows how to get the free output matched to the /proc/meminfo fields in Red Hat Enterprise Linux 7.1 or later (procps-ng 3.3.10).free cmd output coresponding /proc/meminfo fields
Mem: total MemTotal
Mem: used MemTotal - MemFree - Buffers - Cached - Slab
Mem: free MemFree
Mem: shared Shmem
Mem: buff/cache Buffers + Cached + Slab
Mem:available MemAvailable
Swap: total SwapTotal
Swap: used SwapTotal - SwapFree
Swap: free SwapFree
Most stuff is taken from the kernel documentation(Documentation/filesystems/proc.txt and Documentation/vm/hugetlbpage.txt)
High Level statistics
RHEL 5,6,7
MemTotal: Total usable memory
MemFree: The amount of physical memory not used by the system
Buffers: Memory in buffer cache, so relatively temporary storage for raw disk blocks. This shouldn't get very large.
Cached: Memory in the pagecache (Diskcache and Shared Memory)
SwapCached: Memory that is present within main memory, but also in the swapfile. (If memory is needed this area does not need to be swapped out AGAIN because it is already in the swapfile. This saves I/O and increases performance if machine runs short on memory.)
RHEL 7 only
MemAvailable: An estimate of how much memory is available for starting new applications, without swapping.
Detailed Level statistics
RHEL 5,6,7
Active: Memory that has been used more recently and usually not swapped out or reclaimed
Inactive: Memory that has not been used recently and can be swapped out or reclaimed
RHEL 6,7 only
Active(anon): Anonymous memory that has been used more recently and usually not swapped out
Inactive(anon): Anonymous memory that has not been used recently and can be swapped out
Active(file): Pagecache memory that has been used more recently and usually not reclaimed until needed
Inactive(file): Pagecache memory that can be reclaimed without huge performance impact
Unevictable: Unevictable pages can't be swapped out for a variety of reasons
Mlocked: Pages locked to memory using the mlock() system call. Mlocked pages are also Unevictable.
Memory statistics
RHEL 5,6,7
SwapTotal: Total swap space available
SwapFree: The remaining swap space available
Dirty: Memory waiting to be written back to disk
Writeback: Memory which is actively being written back to disk
AnonPages: Non-file backed pages mapped into userspace page tables
Mapped: Files which have been mmaped, such as libraries
Slab: In-kernel data structures cache
PageTables: Amount of memory dedicated to the lowest level of page tables. This can increase to a high value if a lot of processes are attached to the same shared memory segment.
NFS_Unstable: NFS pages sent to the server, but not yet commited to the storage
Bounce: Memory used for block device bounce buffers
CommitLimit: Based on the overcommit ratio (vm.overcommit_ratio), this is the total amount of memory currently available to be allocated on the system. This limit is only adhered to if strict overcommit accounting is enabled (mode 2 in vm.overcommit_memory).
Committed_AS: The amount of memory presently allocated on the system. The committed memory is a sum of all of the memory which has been allocated by processes, even if it has not been "used" by them as of yet.
VmallocTotal: total size of vmalloc memory area
VmallocUsed: amount of vmalloc area which is used
VmallocChunk: largest contiguous block of vmalloc area which is free
HugePages_Total: Number of hugepages being allocated by the kernel (Defined with vm.nr_hugepages)
HugePages_Free: The number of hugepages not being allocated by a process
HugePages_Rsvd: The number of hugepages for which a commitment to allocate from the pool has been made, but no allocation has yet been made.
Hugepagesize: The size of a hugepage (usually 2MB on an Intel based system)
RHEL 6,7 only
Shmem: Total used shared memory (shared between several processes, thus including RAM disks, SYS-V-IPC and BSD like SHMEM)
SReclaimable: The part of the Slab that might be reclaimed (such as caches)
SUnreclaim: The part of the Slab that can't be reclaimed under memory pressure
KernelStack: The memory the kernel stack uses. This is not reclaimable.
WritebackTmp: Memory used by FUSE for temporary writeback buffers
HardwareCorrupted: The amount of RAM the kernel identified as corrupted / not working
AnonHugePages: Non-file backed huge pages mapped into userspace page tables
HugePages_Surp: The number of hugepages in the pool above the value in vm.nr_hugepages. The maximum number of surplus hugepages is controlled by vm.nr_overcommit_hugepages.
DirectMap4k: The amount of memory being mapped to standard 4k pages
DirectMap2M: The amount of memory being mapped to hugepages (usually 2MB in size)
DirectMap1G. The amount of memory being mapped to hugepages (usually 1GB in size)
Note for DirectMap1G: This value will only be available in /proc/meminfo provided the respective CPU hardware supports it. You can verify the same by checking for flag 'pdpe1gb' in /proc/cpuinfo.
htop中计算内存用量的公式
Total used memory = MemTotal - MemFree
Cached memory = Cached + SReclaimable - Shmem
Swap = SwapTotal - SwapFree
In the htop source code: linux/LinuxProcessList.c and linux/Platform.c.
Linux /proc/meminfo 文件转译
MemTotal:所有可用的内存大小,物理内存减去预留位和内核使用。系统从加电开始到引导完成,firmware/bios要预留一些内存,内核本身要占用一些内存,最后剩下可供内核支配的内存就是MemTotal。这个值在系统运行期间一般是固定不变的,重启会改变。
MemFree:表示系统尚未使用的内存。
MemAvailable:真正的系统可用内存,系统中有些内存虽然已被使用但是可以回收的,比如cache/buffer、slab都有一部分可以回收,所以这部分可回收的内存加上MemFree才是系统可用的内存
Buffers:用来给块设备做缓存的内存(文件系统的 metadata、pages)
Cached:分配给文件缓冲区的内存,例如vi一个文件,就会将未保存的内容写到该缓冲区
SwapCached:被高速缓冲存储用的交换空间(硬盘的swap)的大小
active:经常使用的高速缓冲存储器页面文件大小
Inactive:不经常使用的高速缓冲存储器文件大小
Active(anon):活跃的匿名内存
Inactive(anon):不活跃的匿名内存
Active(file):活跃的文件使用内存
Inactive(file):不活跃的文件使用内存
Unevictable:不能被释放的内存页
Mlocked:系统调用 mlock 家族允许程序在物理内存上锁住它的部分或全部地址空间。这将阻止Linux 将这个内存页调度到交换空间(swap space),即使该程序已有一段时间没有访问这段空间
SwapTotal:交换空间总内存
SwapFree:交换空间空闲内存
Dirty:等待被写回到磁盘的
Writeback:正在被写回的
AnonPages:未映射页的内存/映射到用户空间的非文件页表大小
Mapped:映射文件内存
Shmem:已经被分配的共享内存
Slab:内核数据结构缓存
SReclaimable:可收回slab内存
SUnreclaim:不可收回slab内存
KernelStack:内核消耗的内存
PageTables:管理内存分页的索引表的大小
NFS_Unstable:不稳定页表的大小
Bounce:在低端内存中分配一个临时buffer作为跳转,把位于高端内存的缓存数据复制到此处消耗的内存
WritebackTmp:FUSE用于临时写回缓冲区的内存
CommitLimit:系统实际可分配内存
Committed_AS:系统当前已分配的内存
VmallocTotal:预留的虚拟内存总量
VmallocUsed:已经被使用的虚拟内存
VmallocChunk:可分配的最大的逻辑连续的虚拟内存
HardwareCorrupted:当系统检测到内存的硬件故障时删除掉的内存页的总量
AnonHugePages:匿名大页缓存
CmaTotal:连续可用内存总量
CmaFree:空闲连续可用内存
HugePages_Total:预留的大页内存总量
HugePages_Free:空闲的大页内存
HugePages_Rsvd:已经被应用程序分配但尚未使用的大页内存
HugePages_Surp:初始大页数与修改配置后大页数的差值
Hugepagesize:单个大页内存的大小
DirectMap4k:映射TLB为4kB的内存数量
DirectMap2M:映射TLB为2M的内存数量
DirectMap1G:映射TLB为1G的内存数量
参考来源:
/proc/meminfo and free for RHEL 5,6,7
Measure Memory Usage in Linux
该文章最后由 阿炯 于 2022-08-11 22:22:28 更新,目前是第 2 版。