
检查mysql状态的相关命令:
show status:显示系统状态,服务器运行的各种状态值
show variables:显示系统变量,服务器配置信息
show processlist:显示进程状态
show profiles:收集执行查询资源信息 默认是关闭的 开启 set profiling=1;
SHOW ENGINE INNODB STATUS\G:显示innodb存储引擎的状态
MySQL的每个连接任何时刻都有一个状态,Show full processlist查看,最为常见的状态有如下的几种:
Sleep:线程正在等待客户端发送新的请求
Query:线程正在执行查询或者正在将结果发送给客户端
Locked:mysql服务器层, 该线程正在等待表锁(存储引擎实现的锁并不会在此反映如行锁). 对于myisam来说这是一个比较典型的状态, 但在其他没有行锁的引擎中也经常出现
Analyzing and statistics:线程正在收集存储引擎的统计信息, 并生成查询的执行计划
Copying to tmp table [on disk]:线程正在执行查询, 并且将结果集都复制到一个临时表中, 这种状态一般要么是在做group by操作, 要么是在file sort, 或者union;on disk标记表示mysql正在将一个内存临时表放到磁盘上
Sorting result:线程正在对结果集进行排序
Sending data:多种情况: 可能是线程在多个状态之间传送数据;或者生成结果;或者向客户端返回数据
-------------------------------
processlist命令的输出结果显示了有哪些线程在运行,可以帮助识别出有问题的查询语句,两种方式使用这个命令:
1.进入mysql/bin目录下输入mysqladmin --user=<user> --password=<password> processlist2.登入mysql,输入show processlist;
如果有 SUPER 权限,则可以看到全部的线程,否则,只能看到自己发起的线程(这是指当前对应的MySQL帐户运行的线程)。
得到数据形式如下:
mysql> show processlist;
+-----+-------------+--------------------+-------+---------+-------+----------------------------------+----------
| Id | User | Host | db | Command | Time| State | Info
+-----+-------------+--------------------+-------+---------+-------+----------------------------------+----------
|207|root |192.168.0.20:51718 |mytest | Sleep | 5 | | NULL
|208|root |192.168.0.20:51719 |mytest | Sleep | 5 | | NULL
......
|220|root |192.168.0.30:51731 |mytest |Query | 84 | Locked |
先简单说一下各列的含义和用途
第一列,id,不用说了吧,一个标识,你要kill一个语句的时候很有用。
user列,显示单前用户,如果不是root,这个命令就只显示你权限范围内的sql语句。
host列,显示这个语句是从哪个ip的哪个端口上发出的。可以用来追踪出问题语句的用户。
db列,显示这个进程目前连接的是哪个数据库。
command列,显示当前连接的执行的命令,一般就是休眠(sleep),查询(query),连接(connect)。
time列,此这个状态持续的时间,单位是秒。
state列,显示使用当前连接的sql语句的状态,很重要的列,后续会有所有的状态的描述,请注意,state只是语句执行中的某一个状态,一个sql语句,已查询为例,可能需要经过copying to tmp table,Sorting result,Sending data等状态才可以完成。
info列,显示这个sql语句。
如果你在一个容量大的表中执行增删改字段或执行一个复杂的sql 查询导致mysql线程挂起.可用此命令查看出是哪些sql挂起,用kill命令把他杀掉。
kill命令使用方法
kill pid
如上例中我们想kill掉id为207的线程则执行'kill 207'即可。
mysql show processlist详解
SHOW PROCESSLIST显示哪些线程正在运行。您也可以使用mysqladmin processlist语句得到此信息。如果您有SUPER权限,您可以看到所有线程。否则,您只能看到您自己的线程(也就是,与您正在使用的MySQL账户相关的线程)。请参见13.5.5.3节,“KILL语法”。如果您不使用FULL关键词,则只显示每个查询的前100个字符。
本语句报告TCP/IP连接的主机名称(采用host_name:client_port格式),以方便地判定哪个客户端正在做什么。
如果您得到“too many connections”错误信息,并且想要了解正在发生的情况,本语句是非常有用的。MySQL保留一个额外的连接,让拥有SUPER权限的账户使用,以确保管理员能够随时连接和检查系统(假设您没有把此权限给予所有的用户)。
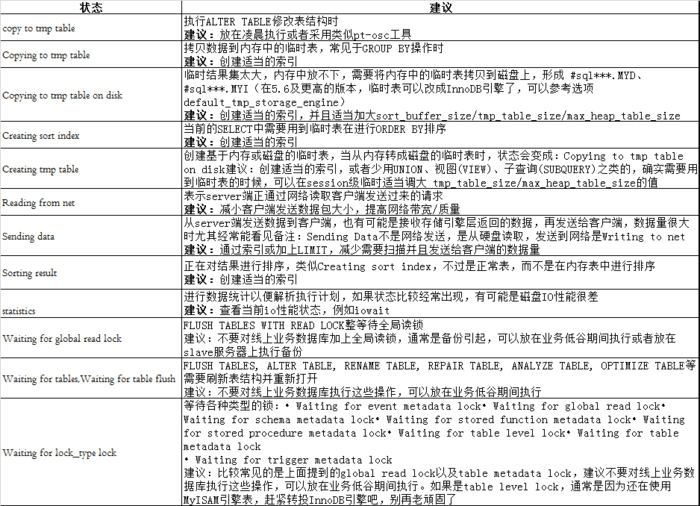
这个命令中最关键的就是state列,mysql列出的状态主要有以下几种:
Checking table
正在检查数据表(这是自动的)。
Closing tables
正在将表中修改的数据刷新到磁盘中,同时正在关闭已经用完的表。这是一个很快的操作,如果不是这样的话,就应该确认磁盘空间是否已经满了或者磁盘是否正处于重负中。
Connect Out
复制从服务器正在连接主服务器。
Copying to tmp table on disk
由于临时结果集大于tmp_table_size,正在将临时表从内存存储转为磁盘存储以此节省内存。
Creating tmp table
正在创建临时表以存放部分查询结果。
deleting from main table
服务器正在执行多表删除中的第一部分,刚删除第一个表。
deleting from reference tables
服务器正在执行多表删除中的第二部分,正在删除其他表的记录。
Flushing tables
正在执行FLUSH TABLES,等待其他线程关闭数据表。
Killed
发送了一个kill请求给某线程,那么这个线程将会检查kill标志位,同时会放弃下一个kill请求。MySQL会在每次的主循环中检查kill标志位,不过有些情况下该线程可能会过一小段才能死掉。如果该线程程被其他线程锁住了,那么kill请求会在锁释放时马上生效。
Locked
被其他查询锁住了。
Sending data
正在处理SELECT查询的记录,同时正在把结果发送给客户端。
Sorting for group
正在为GROUP BY做排序。
Sorting for order
正在为ORDER BY做排序。
Opening tables
这个过程应该会很快,除非受到其他因素的干扰。例如,在执ALTER TABLE或LOCK TABLE语句行完以前,数据表无法被其他线程打开。正尝试打开一个表。
Removing duplicates
正在执行一个SELECT DISTINCT方式的查询,但是MySQL无法在前一个阶段优化掉那些重复的记录。因此,MySQL需要再次去掉重复的记录,然后再把结果发送给客户端。
Reopen table
获得了对一个表的锁,但是必须在表结构修改之后才能获得这个锁。已经释放锁,关闭数据表,正尝试重新打开数据表。
Repair by sorting
修复指令正在排序以创建索引。
Repair with keycache
修复指令正在利用索引缓存一个一个地创建新索引。它会比Repair by sorting慢些。
Searching rows for update
正在讲符合条件的记录找出来以备更新。它必须在UPDATE要修改相关的记录之前就完成了。
Sleeping
正在等待客户端发送新请求。
System lock
正在等待取得一个外部的系统锁。如果当前没有运行多个mysqld服务器同时请求同一个表,那么可以通过增加--skip-external-locking参数来禁止外部系统锁。
Upgrading lock
INSERT DELAYED正在尝试取得一个锁表以插入新记录。
Updating
正在搜索匹配的记录,并且修改它们。
User Lock
正在等待GET_LOCK()。
Waiting for tables
该线程得到通知,数据表结构已经被修改了,需要重新打开数据表以取得新的结构。为了能的重新打开数据表,必须等到所有其他线程关闭这个表。以下几种情况下会产生这个通知:FLUSH TABLES tbl_name, ALTER TABLE, RENAME TABLE, REPAIR TABLE, ANALYZE TABLE,或OPTIMIZE TABLE。
waiting for handler insert
INSERT DELAYED已经处理完了所有待处理的插入操作,正在等待新的请求。大部分状态对应很快的操作,只要有一个线程保持同一个状态好几秒钟,那么可能是有问题发生了,需要检查一下。还有其他的状态没在上面中列出来,不过它们大部分只是在查看服务器是否有存在错误是才用得着。
mysql> show processlist;
如果是root帐号,你能看到所有用户的当前连接。如果是其它普通帐号,只能看到自己占用的连接。show processlist;只列出前100条,如果想全列出请使用show full processlist;
-------------------------
Aborted_clients 由于客户没有正确关闭连接已经死掉,已经放弃的连接数量。基于某种原因客户程序不能正常关闭连接而导致失败的连接的数量。如果客户不在退出之前调整mysql_close()函数,wait_timeout或interactive_timeout的限制已经被超出,或者是客户端程序在传输的过程中被关闭,则这种情况会发生。
Aborted_connects 尝试已经失败的MySQL服务器的连接的次数。这种情况在客户尝试用错误的密码进行连接时,没有权限进行连接时,为获得连接的数据包所花费的时间超过了connect_timeout限制的秒数,或数据包中没有包含正确的信息时,都会发生。
Connections 试图连接MySQL服务器的次数。
Binlog_cache_disk_use 使用临时二进制日志缓存但超过binlog_cache_size值并使用临时文件来保存事务中的语句的事务数量。
Binlog_cache_use 使用临时二进制日志缓存的事务数量。
Binlog_stmt_cache_disk_use
The number of nontransaction statements that used the binary log statement cache but that exceeded the value of binlog_stmt_cache_size and used a temporary file to store those statements.
当非事务语句使用二进制日志缓存,但是超出binlog_stmt_cache_size时,使用一个临时文件来存放这些语句。
Binlog_stmt_cache_use
The number of nontransactional statements that used the binary log statement cache.
使用二进制日志缓存文件的非事务语句数量。
Bytes_received 从所有客户端接收到的字节数。
Bytes_sent 发送给所有客户端的字节数。
Com_xxx
Com_xxx 语句计数变量表示每个xxx 语句执行的次数。每类语句有一个状态变量。例如,Com_delete和Com_insert分别统计DELETE 和INSERT语句执行的次数。
Compression
客户端是否使用了压缩的连接协议。
Connections
试图连接到(不管是否成功)MySQL服务器的连接数。
Created_tmp_disk_tables
服务器执行语句时在硬盘上自动创建的临时表的数量。
Created_tmp_files
mysqld已经创建的临时文件的数量。
Created_tmp_tables 当执行语句时,已经被创造了的隐含临时表的数量。如果Created_tmp_disk_tables较大,你可能要增加tmp_table_size值使临时表基于内存而不基于硬盘。
Delayed_insert_threads 正在使用的延迟插入处理器线程的数量。
Delayed_writes 用INSERT DELAYED写入的行数。
Delayed_errors 用INSERT DELAYED写入的发生某些错误(可能重复键值)的行数。
Flush_commands 执行FLUSH命令的次数。
Handler_delete 请求从一张表中删除行的次数。
Handler_read_first 请求读入表中第一行的次数。
Handler_read_key 请求数字基于键读行。
Handler_read_next 请求读入基于一个键的一行的次数。
Handler_read_rnd 请求读入基于一个固定位置的一行的次数。
Handler_update 请求更新表中一行的次数。
Handler_write 请求向表中插入一行的次数。
Key_blocks_used 用于关键字缓存的块的数量。
Key_read_requests 请求从缓存读入一个键值的次数。
Key_reads 从磁盘物理读入一个键值的次数。
Key_write_requests 请求将一个关键字块写入缓存次数。
Key_writes 将一个键值块物理写入磁盘的次数。
Max_used_connections 同时使用的连接的最大数目。
Not_flushed_key_blocks 在键缓存中已经改变但是还没被清空到磁盘上的键块。
Not_flushed_delayed_rows 在INSERT DELAY队列中等待写入的行的数量。
Open_tables 打开表的数量。
Open_files 打开文件的数量。
Open_streams 打开流的数量(主要用于日志记载)
Opened_tables 已经打开的表的数量。
Questions 发往服务器的查询的数量。
Slow_queries 要花超过long_query_time时间的查询数量。
Threads_cached 线程缓存内的线程的数量。
Threads_connected 当前打开的连接的数量。
Threads_created 创建用来处理连接的线程数。如果Threads_created较大,你可能要增加thread_cache_size值。缓存访问率的计算方法Threads_created/Connections。该值越接近1,说明线程cache的命中率越低,就应该考虑增加thread_cache_size这个参数的值。
Threads_running 激活的(非睡眠状态)线程数。
Table_open_cache_hits 打开一个表时,在表缓存查找中的命中次数,这个变量是在MySQL 5.6.6中添加的,这个值越高越好。
Table_open_cache_misses 打开一个表时,在表缓存查找中的未命中次数,这个变量是在MySQL 5.6.6中添加的,和上面相反,该值越低越好。
Table_open_cache_overflows 打开表缓存的溢出次数,这个变量是在MySQL 5.6.6中添加的。如果打开表的总数大于table_open_cache/table_open_cache_instances数量,后续的查询中又开始使用被清理出cache instance的表,那么此时就会导致Table_open_cache_misses和Table_open_cache_overflows值的增加。主要体现在高并发的情况下,频繁打开/关闭表和多表联结查询,造成table_open_cache/table_open_cache_instances不够用,需要设大一点来应对,最好比表的总数量多一倍。
Uptime 服务器工作了多少秒。
连接失败情况
show status like'%aborted%'
Aborted_clients 客户端非法中断连接次数 如果随时间而增大 看看mysql的链接是否正常 或者检查一下网络 或者检查一下max_allowed_packet 超过此设置的查询会被中断( show variables like'%max%')
Aborted_connects 连接mysql失败次数 如果指过高那就该检查一下网络错误链接失败会在此记录
慢查询:
show variables like '%slow%'
show status like '%slow%';
默认是关闭的 开启 set global log_slow_queries=ON;
Slow_launch_threads 值较大则说明有些东西正在延迟链接的新线程
连接数
show variables like 'max_connections' 最大连接数
show status like 'max_used_connections'响应的连接数
max_used_connections / max_connections * 100% (理想值 ≈ 85%)
如果max_used_connections跟max_connections相同 那么就是max_connections设置过低或者超过服务器负载上限了
缓存簇
show status like 'key_blocks_u%';使用和未使用缓存簇(blocks)数
show variables like '%Key_cache%';
show variables like '%Key_buffer_size%';
如果Key_blocks_used * key_cache_block_size 远小于key_buffer_size 那么就意味着内存有浪费了,应该调大key_buffer_size值
线程使用情况
show status like 'Thread%';如果发现Threads_created值过大的话,可以适当增加配置文件中thread_cache_size值
Threads_cached用来缓存线程,如果在MySQL服务器配置文件中设置了thread_cache_size,当客户端断开之后,服务器处理此客户的线程将会缓存起来以响应下一个客户而不是销毁(前提是缓存数未达上限)。Threads_created表示创建过的线程数,如果发现Threads_created值过大的话,表明 MySQL服务器一直在创建线程,这也是比较耗资源,可以适当增加配置文件中thread_cache_size值
mysql> show global status like 'Thread%';
+-------------------+-------+
| Variable_name | Value |
+-------------------+-------+
| Threads_cached | 46 |
| Threads_connected | 2 |
| Threads_created | 570 |
| Threads_running | 1 |
+-------------------+-------+
如果在MySQL服务器配置文件中设置了thread_cache_size,当客户端断开之后,服务器处理此客户的线程将会缓存起来以响应下一个请求而不是销毁(前提是缓存数未达上限)。Threads_created表示创建过的线程数,如果发现Threads_created值过大的话,表明 MySQL服务器一直在创建线程,这也是比较耗资源,可以适当增加配置文件中thread_cache_size值,查询服务器 thread_cache_size配置:
mysql> show variables like 'thread_cache_size';
+-------------------+-------+
| Variable_name | Value |
+-------------------+-------+
| thread_cache_size | 64 |
+-------------------+-------+
上例中的服务器还是比较健康的。
打开的文件数
show status like '%open_file%';
show variables like '%open_file%';
如果Open_files和open_files_limit接近就应该增加open_files_limit的大小
不过mysql打开的文件描述符限制都是OS的文件描述符限制,和配置文件中open_files_limit的设置没有关系
mysql> show global status like 'open_files';
+---------------+-------+
| Variable_name | Value |
+---------------+-------+
| Open_files | 1510 |
+---------------+-------+
mysql> show variables like 'open_files_limit';
+------------------+-------+
| Variable_name | Value |
+------------------+-------+
| open_files_limit | 4690 |
+------------------+-------+
比较合适的设置:Open_files / open_files_limit * 100% <= 75%
打开表情况
show status like 'open_tables%';
如果open_tables接近table_cache的时候,并且Opened_tables这个值在逐步增加,说明table_cache不够用表缓存没有完全用上,那就要考虑增加table_cache的大小了。还有就是Table_locks_waited比较高的时候,也需要增加table_cache。
查询缓存
show status like 'qcache%';
Qcache_free_blocks:缓存中相邻内存块的个数,数目大说明可能有碎片。FLUSH QUERY CACHE会对缓存中的碎片进行整理,从而得到一个空闲块。
Qcache_free_memory:缓存中的空闲内存。
Qcache_hits:每次查询在缓存中命中时就增大
Qcache_inserts:每次插入一个查询时就增大。命中次数除以插入次数就是不中比率。
Qcache_lowmem_prunes:缓存出现内存不足并且必须要进行清理以便为更多查询提供空间的次数。这个数字最好长时间来看;如果这个数字在不断增长,就表示可能碎片非常严重,或者内存很少。(上面的free_blocks和free_memory可以告知属于哪种情况)
Qcache_not_cached:不适合进行缓存的查询的数量,通常是由于这些查询不是 SELECT 语句或者用了now()之类的函数。
Qcache_queries_in_cache:当前缓存的查询(和响应)的数量。
Qcache_total_blocks:缓存中块的数量。
show variables like 'query_cache%';察看query_cache的配置
query_cache_limit:超过此大小的查询将不缓存
query_cache_min_res_unit:缓存块的最小大小
query_cache_size:查询缓存大小
query_cache_type:缓存类型,决定缓存什么样的查询,示例中表示不缓存 select sql_no_cache 查询
query_cache_wlock_invalidate:当有其他客户端正在对MyISAM表进行写操作时,如果查询在query cache中,是否返回cache结果还是等写操作完成再读表获取结果。
query_cache_min_res_unit的配置是一柄”双刃剑”,默认是4KB,设置值大对大数据查询有好处,但如果你的查询都是小数据查询,就容易造成内存碎片和浪费。
查询缓存碎片率 = Qcache_free_blocks / Qcache_total_blocks * 100%
如果查询缓存碎片率超过20%,可以用FLUSH QUERY CACHE整理缓存碎片,或者试试减小query_cache_min_res_unit,如果你的查询都是小数据量的话。
查询缓存利用率 = (query_cache_size – Qcache_free_memory) / query_cache_size * 100%
查询缓存利用率在25%以下的话说明query_cache_size设置的过大,可适当减小;查询缓存利用率在80%以上而且Qcache_lowmem_prunes > 50的话说明query_cache_size可能有点小,要不就是碎片太多。
查询缓存命中率 = (Qcache_hits – Qcache_inserts) / Qcache_hits * 100%
排序情况
show status like 'sort%';
Sort_merge_passes过大 就要增加Sort_buffer_size,Sort_merge_passes 包括两步。MySQL 首先会尝试在内存中做排序,使用的内存大小由系统变量 Sort_buffer_size 决定,如果它的大小不够把所有的记录都读到内存中,MySQL 就会把每次在内存中排序的结果存到临时文件中,等 MySQL 找到所有记录之后,再把临时文件中的记录做一次排序。这再次排序就会增加 Sort_merge_passes。实际上,MySQL 会用另一个临时文件来存再次排序的结果,所以通常会看到 Sort_merge_passes 增加的数值是建临时文件数的两倍。因为用到了临时文件,所以速度可能会比较慢,增加 Sort_buffer_size 会减少 Sort_merge_passes 和 创建临时文件的次数。但盲目的增加 Sort_buffer_size 并不一定能提高速度。
高速缓存
show variables like 'key_buffer_size';MyISAM 存储引擎键高速缓存 对MyISAM表性能影响很大大
show status like 'key_read%';磁盘读取索引的请求次数
索引未命中缓存的概率=Key_reads / Key_read_requests * 100%
不能以Key_read_requests / Key_reads原则来设置key_buffer_size
Key_reads 将这个值和系统的i/o做对比
表锁情况
show status like 'table_locks%';
Table_locks_waited显示了多少表锁住并导致了mysql的锁等待,可以开启慢查询看一下
Table_locks_immediate 表示立即释放表锁数,Table_locks_waited表示需要等待的表锁数,如果 Table_locks_immediate / Table_locks_waited > 5000,最好采用InnoDB引擎,因为InnoDB是行锁而MyISAM是表锁,对于高并发写入的应用InnoDB效果会好些
表扫描情况
show status like 'handler_read%';
show status like 'com_select';
如果Handler_read_rnd_next /Handler_read_rnd 的值过大 那么就应该优化索引、查询
表扫描率 = Handler_read_rnd_next / Com_select
如果表扫描率超过4000,说明进行了太多表扫描,很有可能索引没有建好,增加read_buffer_size值会有一些好处,但最好不要超过8MB
临时表情况
show status like 'created_tmp%';
show variables like 'tmp_table%';
show variables like 'max_heap%';
如果Created_tmp_disk_tables值较高 则有可能是因为:tmp_table_size或者max_heap_table_size太小
或者是选择blob、text属性的时候创建了临时表
Created_tmp_tables 过高的话那么就有用查询吧
二进制日志缓存
show status like '%binlog%';
show variables like '%binlog%';
如果Binlog_cache_disk_use 和 Binlog_cache_use 比例很大,那么就应该增加binlog_cache_size的值
关于Performance_schema的含义:
MySQL 5.5新增一个存储引擎:命名PERFORMANCE_SCHEMA,主要用于收集数据库服务器性能参数。MySQL用户是不能创建存储引擎为PERFORMANCE_SCHEMA的表,它提供以下功能:
1)、提供进程等待的详细信息,包括锁、互斥变量、文件信息;
2)、保存历史的事件汇总信息,为提供MySQL服务器性能做出详细的判断;
3)、对于新增和删除监控事件点都非常容易,并可以随意改变mysql服务器的监控周期,例如(CYCLE、MICROSECOND)
After create
This occurs when the thread creates a table (including internal temporary tables), at the end of the function that creates the table. This state is used even if the table could not be created due to some error.
Analyzing
The thread is calculating a MyISAM table key distributions (for example, for ANALYZE TABLE).
checking permissions
The thread is checking whether the server has the required privileges to execute the statement.
Checking table
The thread is performing a table check operation.
cleaning up
The thread has processed one command and is preparing to free memory and reset certain state variables.
closing tables
The thread is flushing the changed table data to disk and closing the used tables. This should be a fast operation. If not, you should verify that you do not have a full disk and that the disk is not in very heavy use.
converting HEAP to MyISAM
The thread is converting an internal temporary table from a MEMORY table to an on-disk MyISAM table.
copy to tmp table
The thread is processing an ALTER TABLE statement. This state occurs after the table with the new structure has been created but before rows are copied into it.
Copying to group table
If a statement has different ORDER BY and GROUP BY criteria, the rows are sorted by group and copied to a temporary table.
Copying to tmp table
The server is copying to a temporary table in memory.
Copying to tmp table on disk
The server is copying to a temporary table on disk. The temporary result set was larger than tmp_table_size and the thread is changing the temporary table from in-memory to disk-based format to save memory.
Creating index
The thread is processing ALTER TABLE ... ENABLE KEYS for a MyISAM table.
Creating sort index
The thread is processing a SELECT that is resolved using an internal temporary table.
creating table
The thread is creating a table. This includes creation of temporary tables.
Creating tmp table
The thread is creating a temporary table in memory or on disk. If the table is created in memory but later is converted to an on-disk table, the state during that operation will be Copying to tmp table on disk.
deleting from main table
The server is executing the first part of a multiple-table delete. It is deleting only from the first table, and saving columns and offsets to be used for deleting from the other (reference) tables.
deleting from reference tables
The server is executing the second part of a multiple-table delete and deleting the matched rows from the other tables.
discard_or_import_tablespace
The thread is processing an ALTER TABLE ... DISCARD TABLESPACE or ALTER TABLE ... IMPORT TABLESPACE statement.
end
This occurs at the end but before the cleanup of ALTER TABLE, CREATE VIEW, DELETE, INSERT, SELECT, or UPDATE statements.
executing
The thread has begun executing a statement.
Execution of init_command
The thread is executing statements in the value of the init_command system variable.
freeing items
The thread has executed a command. This state is usually followed by cleaning up.
Flushing tables
The thread is executing FLUSH TABLES and is waiting for all threads to close their tables.
FULLTEXT initialization
The server is preparing to perform a natural-language full-text search.
init
This occurs before the initialization of ALTER TABLE, DELETE, INSERT, SELECT, or UPDATE statements.
Killed
Someone has sent a KILL statement to the thread and it should abort next time it checks the kill flag. The flag is checked in each major loop in MySQL, but in some cases it might still take a short time for the thread to die. If the thread is locked by some other thread, the kill takes effect as soon as the other thread releases its lock.
Locked
The query is locked by another query.
logging slow query
The thread is writing a statement to the slow-query log.
NULL
This state is used for the SHOW PROCESSLIST state.
login
The initial state for a connection thread until the client has been authenticated successfully.
Opening tables, Opening table
The thread is trying to open a table. This is should be very fast procedure, unless something prevents opening. For example, an ALTER TABLE or a LOCK TABLE statement can prevent opening a table until the statement is finished.
preparing
This state occurs during query optimization.
Purging old relay logs
The thread is removing unneeded relay log files.
query end
This state occurs after processing a query but before the freeing items state.
Reading from net
The server is reading a packet from the network.
Removing duplicates
The query was using SELECT DISTINCT in such a way that MySQL could not optimize away the distinct operation at an early stage. Because of this, MySQL requires an extra stage to remove all duplicated rows before sending the result to the client.
removing tmp table
The thread is removing an internal temporary table after processing a SELECT statement. This state is not used if no temporary table was created.
rename
The thread is renaming a table.
rename result table
The thread is processing an ALTER TABLE statement, has created the new table, and is renaming it to replace the original table.
Reopen tables
The thread got a lock for the table, but noticed after getting the lock that the underlying table structure changed. It has freed the lock, closed the table, and is trying to reopen it.
Repair by sorting
The repair code is using a sort to create indexes.
Repair done
The thread has completed a multi-threaded repair for a MyISAM table.
Repair with keycache
The repair code is using creating keys one by one through the key cache. This is much slower than Repair by sorting.
Rolling back
The thread is rolling back a transaction.
Saving state
For MyISAM table operations such as repair or analysis, the thread is saving the new table state to the .MYI file header. State includes information such as number of rows, the AUTO_INCREMENT counter, and key distributions.
Searching rows for update
The thread is doing a first phase to find all matching rows before updating them. This has to be done if the UPDATE is changing the index that is used to find the involved rows.
Sending data
The thread is processing rows for a SELECT statement and also is sending data to the client.
setup
The thread is beginning an ALTER TABLE operation.
Sorting for group
The thread is doing a sort to satisfy a GROUP BY.
Sorting for order
The thread is doing a sort to satisfy a ORDER BY.
Sorting index
The thread is sorting index pages for more efficient access during a MyISAM table optimization operation.
Sorting result
For a SELECT statement, this is similar to Creating sort index, but for nontemporary tables.
statistics
The server is calculating statistics to develop a query execution plan.
System lock
The thread is going to request or is waiting for an internal or external system lock for the table. If this state is being caused by requests for external locks and you are not using multiple mysqld servers that are accessing the same tables, you can disable external system locks with the --skip-external-locking option. However, external locking is disabled by default, so it is likely that this option will have no effect. For SHOW PROFILE, this state means the thread is requesting the lock (not waiting for it).
Table lock
The next thread state after System lock. The thread has acquired an external lock and is going to request an internal table lock.
Updating
The thread is searching for rows to update and is updating them.
updating main table
The server is executing the first part of a multiple-table update. It is updating only the first table, and saving columns and offsets to be used for updating the other (reference) tables.
updating reference tables
The server is executing the second part of a multiple-table update and updating the matched rows from the other tables.
User lock
The thread is going to request or is waiting for an advisory lock requested with a GET_LOCK() call. For SHOW PROFILE, this state means the thread is requesting the lock (not waiting for it).
Waiting for tables, Waiting for table
The thread got a notification that the underlying structure for a table has changed and it needs to reopen the table to get the new structure. However, to reopen the table, it must wait until all other threads have closed the table in question.
This notification takes place if another thread has used FLUSH TABLES or one of the following statements on the table in question: FLUSH TABLES tbl_name, ALTER TABLE, RENAME TABLE, REPAIR TABLE, ANALYZE TABLE, or OPTIMIZE TABLE.
Waiting on cond
A generic state in which the thread is waiting for a condition to become true. No specific state information is available.
Writing to net
The server is writing a packet to the network.